
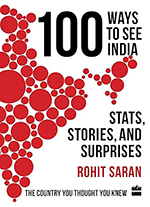
The promise of data visualization for the common man is not just about greater accessibility, but also the possibility of better-informed public discourse. Rohit Saran’s 100 Ways to See India: Stats, Stories, and Surprises is a beginner’s treat for acquainting oneself with datasets and deepening statistical curiosity. The book helps shift the perception that numbers are the exclusive currency of experts, such as economists and policy wonks sitting in statistical departments and research organizations. India’s tryst with data has historically been contained in technocratic institutions and government documents, stacks of NFHS surveys or policy dashboards that require advanced data literacy. Literacy, however, must also be accompanied by a critical eye on the narratives being painted on the backs of numbers. This requires building a critical mass that is comfortable digesting quantitative information.
Saran delimits the scope of his book as an inventory, as a way to measure the dynamism of India’s socio-economic reality, instead of a final verdict; it is, first of all, ‘a data-rich snapshot of India’s many gains and its most glaring gaps’. On one hand, increased broadband connectivity, flourishing of small businesses and improved water supply show where governance has succeeded; on the other, glaring backlogs prevail: a high number of female foeticide incidents and undertrial prisoners lagging under a sluggish judicial system. Data-driven insights offered by the book cover a long arc: from Indians’ meat-eating and drinking habits to structural issues like empowerment gaps in India’s lowest rung of financial and democratic devolution in the form of Panchayati Raj Institutions (PRI). Take, for instance, Saran’s parsing of datasets from the Periodic Labour Force Survey (PLFS), which puts into question the definition of ‘employment’, due to its open-ended nature: free labour under the assumption of unpaid work still being counted as ‘work’ or say, a lack of focus on quality of job or the length of work hours.
Presenting data relating to the shifting landscape of national savings, from traditional savings like bank deposits and gold to speculation: mutual funds and disciplined SIPs. Saran supplements this with the information that these rising saving habits are offset by the increased borrowing that Indians are engaged in. This conflicting data points to a turn towards credit culture, where present consumption is valued, leading to increased liabilities. The author cautions that rising loan culture is not necessarily a bad thing, but feeds into the asset-owning capabilities of the population. This shows how one facet of empirical reality can present a coherent picture until it is made to clash with a contending trend, revealing the tensions that underlie the neatest of datasets.
The range of Saran’s data-driven storytelling is compelling. India’s urban vacant housing problem, the country’s growth being spurred by intangible assets, the cost of raising a child, the hardening of partisan divisions—Saran casts a wide net, devoid of clean causal stories. Occasionally, he attempts to offer hints of antidotes: devolution of power could potentially mitigate polarization, re-evaluation of pro-tenant laws and better contract enforcement could help fill those empty houses.
However, certain infographics, being purely descriptive, also risk being analytically empty for the lay person who is missing adequate context. While doughnut pie charts laying out ownership patterns of NSE-listed companies can be illuminating, the average person does not get meaningfully informed about the implications of categories such as ‘promoter’ and ‘non-promoter’, or about the shifts in equity ownership. Are large-cap stocks being preferred by retail investors? What income bracket are these urban investors coming from? Are Foreign Portfolio Investors (FPIs) investing differently over the last decade, and what sectors are they concentrating on? For more probing questions, stacked area charts over a set time period would better fit the purpose.
Familiar policy talking points taken as ideological truisms also make an entry in Saran’s book. Rich agricultural families and businesses evade taxes through exemptions made for small and marginal farmers, and abuse of tax categories like ‘self-employed’. Among other factors, this contributes to why only 3% of Indians pay taxes. However, policy shuffles in the last few years have increased revenue gains from this demographic: slashes in corporate taxation, government getting better at catching salaried formal-sector workers at the source, and direct taxes becoming more dominant. These surprising detours from one data visual to another are refreshing and do more than just build quantitative literacy; they are training the reader to imagine numbers in different contexts, and implore us to experiment with available data, and not simply bow down to its authority.
The question of poverty statistics is one that has been subject to much politicization: both due to inevitable clashes on methodology, or else just crude suppression of official data, like with the 2017-18 consumption survey, that remains unreleased. By qualifying them with important distinctions, Saran makes these statistics more specific and useful, rather than throwing around empty phrases like ‘sharp decline in poverty’, the layperson is allowed to zoom in on different facets of economic measurement: multidimensional poverty and poverty intensity, consumption inequality versus income inequality, wealth gaps, concentration of economic opportunity in certain regions. The way this book captures these stories in short visual essays makes them both self-contained and quick reference points primed for further interrogation.
The strength of this book lies in the fact that it provokes us to question the conclusions presented by a dataset by breaking down their coherence. Consider one of the initial datasets presented to us: Hindi is the most widely understood language, but that does not automatically translate to it being the primary linguistic identity for most people. Made up of at least 56 dialects, it is subject to the contentious census survey collection on language data—collating thousands of dialects under the umbrella of ‘Hindi’ to make linguistic characterization easily manageable. It asks us to probe deeper when confronted with debates about language imposition: your grandfather with roots in eastern Uttar Pradesh, fluent in Bhojpuri, simply shares a census category with the Khariboli-speaking bureaucrat in Delhi, but what meaningful connection do they hold through this standardization? Ultimately, what dialects get privileged is a matter of politics and history; the book is more interested in serving the purpose of making Indians more comfortable with survey data. Moving comfortably from voter turnout to the rise of chess as a front for India’s sporting ambitions, the informational variety one is exposed to is a valuable trade-off to those craving deeper analysis, at least in order to build a level of comfort in dealing with statistical nuance.
Bringing together his two-and-a-half decades of journalistic experience and a commitment to reviving the potential of an environment abundant in data, Saran attempts something deceptively simple: to plant the seeds of a more quantitatively literate citizenry, to defy the illusion that data interpretation is out of reach for the average person. It builds a certain confidence in numbers through visual appeal and non-preachy storytelling that creates promising conditions for more serious engagement.
Yusra Khan is pursuing a Master’s degree in Political Science at Jamia Millia Islamia, New Delhi.